
For businesses to succeed, they must understand the market they operate in. One way to do this is by calculating their TAM, SAM, and SOM. These acronyms represent different metrics that help businesses determine the size and potential of their target market.
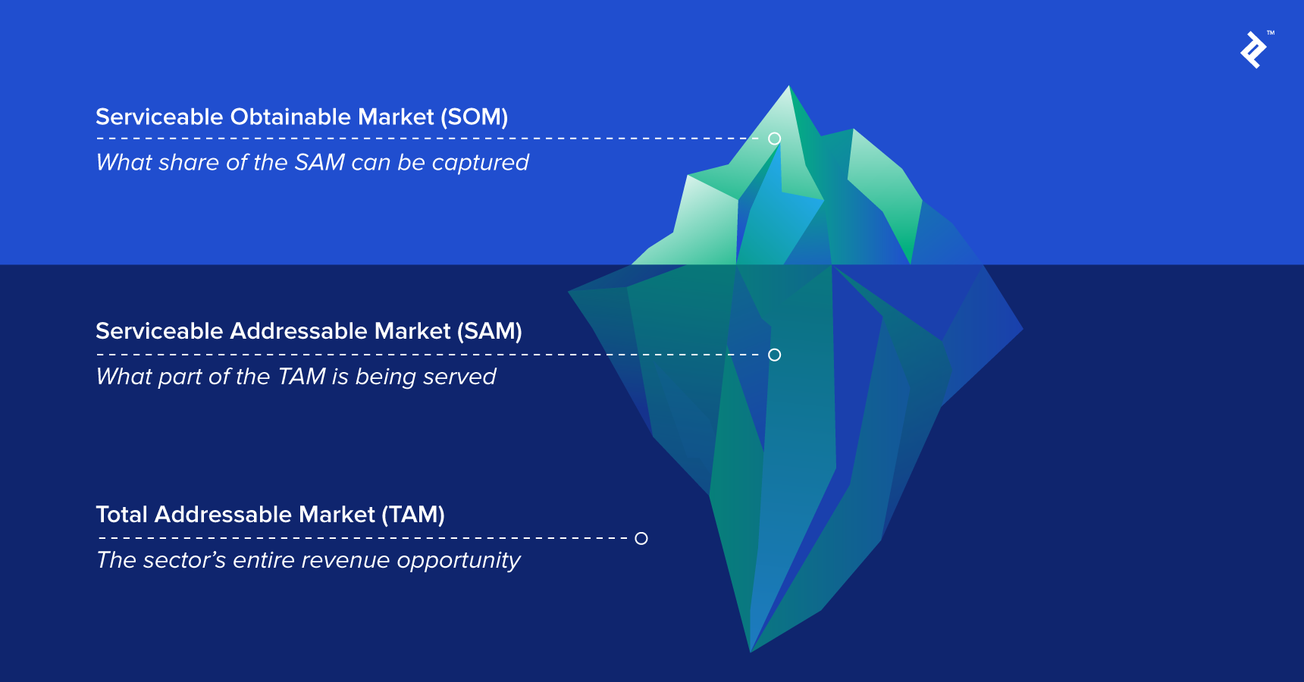
TAM stands for Total Addressable Market, which represents the total revenue opportunity for a product or service if it were to capture 100% market share. In contrast, SAM or Serviceable Addressable Market represents the portion of the TAM that a business can realistically serve given its resources and capabilities. SOM or Share of Market, on the other hand, represents the percentage of the SAM that a business can realistically capture.
Understanding TAM, SAM, and SOM is crucial for businesses as it helps them identify the most profitable market segments and allocate their resources accordingly. By knowing the size and potential of their target market, businesses can create effective marketing and sales strategies, set realistic revenue goals, and make informed decisions about entering new markets.
Market Segmentation
Market segmentation is the process of dividing a market into smaller groups of consumers with similar needs or characteristics. This allows companies to tailor their marketing efforts and product offerings to specific segments, increasing the chances of success in the market.
Total Addressable Market (TAM)
The Total Addressable Market (TAM) is the total market demand for a product or service. It represents the entire market for a product or service, regardless of the competition. It is the largest possible market that a company can target. TAM is important for companies to understand because it helps them determine the potential size of the market and the potential revenue that can be generated.
Serviceable Available Market (SAM)
The Serviceable Available Market (SAM) is the portion of the total addressable market that can actually be served by a company with its current resources and capabilities. SAM takes into account factors such as geography, regulatory restrictions, and pricing/quality differences. It represents the portion of the market that a company can realistically target and serve.
Serviceable Obtainable Market (SOM)
The Serviceable Obtainable Market (SOM) is the portion of the Serviceable Available Market (SAM) that a company can realistically capture, based on its current market share and competition. SOM represents the portion of the market that a company can realistically target and capture with its current resources and capabilities.
Understanding TAM, SAM, and SOM is crucial for companies to develop effective marketing and sales strategies. By segmenting the market and identifying the most attractive segments, companies can tailor their offerings to meet the specific needs of those segments, increasing the chances of success in the market.
Why TAM, SAM, and SOM are Important
Understanding the concepts of TAM, SAM, and SOM is crucial for any business to develop a successful marketing and sales strategy. These metrics help companies identify the potential market size, segment their target audience, and estimate their revenue goals. Here are two key reasons why TAM, SAM, and SOM are important:
Market Analysis
By calculating the TAM, businesses can identify the total market demand for their product or service. This includes everyone in the world who could buy the product, regardless of the competition in the market. Knowing the TAM helps businesses understand the size of the market they are operating in and determine the potential for growth.
Once the TAM is determined, the next step is to calculate the SAM. The SAM is the portion of the TAM that the business can realistically target and serve. This metric helps businesses identify their specific target audience and segment their market based on demographics, geography, and other factors. By segmenting the market, businesses can create targeted marketing campaigns that resonate with their audience and improve their chances of success.
Market Opportunity Assessment
Calculating the SOM helps businesses assess their market opportunity and set realistic revenue goals. The SOM is the portion of the SAM that the business can realistically capture, given the competition in the market. By understanding the SOM, businesses can identify their market share and estimate their revenue potential.
For example, if a business has a TAM of $10 billion, a SAM of $1 billion, and a SOM of 10%, their revenue potential would be $100 million. By setting realistic revenue goals based on their SOM, businesses can create a roadmap for growth and measure their success over time.
Overall, TAM, SAM, and SOM are important metrics for businesses to understand and calculate. By using these metrics, businesses can identify their market size, segment their target audience, and set realistic revenue goals. This knowledge helps businesses create effective marketing and sales strategies and measure their success over time.
How to Calculate TAM, SAM, and SOM
Top-Down Approach
The Top-Down approach is a method of estimating market size by looking at larger, macro-economic trends within a market to narrow-down and determine what percentage a company could capture. This approach is useful when there is limited data available or when the market is too large to be analyzed through a Bottom-Up approach.
For example, if a company wants to estimate the TAM for the global smartphone market, they could start by looking at the total global population, then narrowing down to the number of people who own smartphones, and finally multiplying that number by the average annual revenue per smartphone user. This will give them an estimate of the total addressable market for their product or service.
Bottom-Up Approach
The Bottom-Up approach is a method of estimating market size by counting the total number of customers in a market and multiplying that number by the average annual revenue of each customer in this market. This approach is useful when there is enough data available or when the market is too small to be analyzed through a Top-Down approach.
For example, if a company wants to estimate the TAM for the local coffee shop market, they could start by counting the number of coffee shops in the area, then estimating the average annual revenue per coffee shop, and finally multiplying that number by the total number of coffee shops. This will give them an estimate of the total addressable market for their product or service.
Value-Based Approach
The Value-Based approach is a method of estimating market size by looking at the value that a product or service provides to the customer. This approach is useful when the market is segmented and the company wants to estimate the total addressable market for each segment.
For example, if a company wants to estimate the TAM for the luxury car market, they could start by looking at the total number of people who are willing to pay a premium price for a luxury car, then estimating the average annual revenue per customer, and finally multiplying that number by the total number of customers. This will give them an estimate of the total addressable market for their luxury car product or service.
Limitations of TAM, SAM, and SOM
Assumptions and Biases
While TAM, SAM, and SOM are useful metrics for understanding market potential, they are based on assumptions and biases. For example, the calculation of TAM assumes that every potential customer in the market will buy the product or service, which is not always the case. Additionally, the calculation of SAM assumes that the company can capture a specific percentage of the market, which may not be feasible due to competition or other market dynamics.
Market Dynamics
TAM, SAM, and SOM do not take into account the complexities of market dynamics. For instance, market size can change rapidly due to technological advancements, changes in consumer behavior, and other external factors. As a result, the metrics may become outdated quickly and may not provide an accurate representation of the market potential.
Competitive Landscape
TAM, SAM, and SOM also do not consider the competitive landscape. While TAM represents the total market potential, it does not account for the presence of competitors in the market. Similarly, SAM assumes that the company can capture a specific percentage of the market, but this may not be feasible if there are already established competitors with a significant market share. To address these limitations, companies should use TAM, SAM, and SOM in conjunction with other market research tools and techniques. This will provide a more comprehensive understanding of the market potential and help companies make informed decisions about market entry and growth strategies.


